
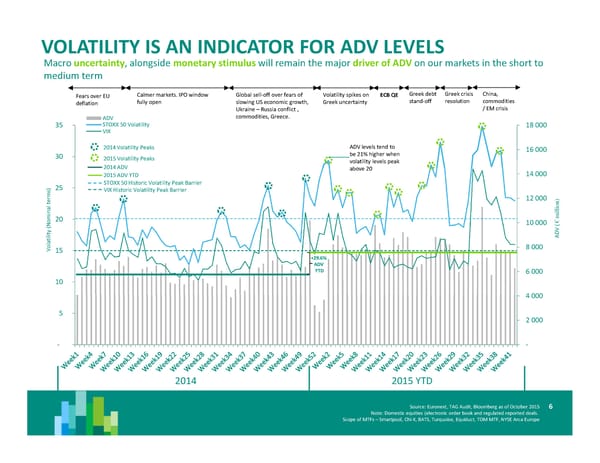
VOLATILITY IS AN INDICATOR FOR ADV LEVELS Macro uncertainty, alongside monetary stimulus will remain the major driver of ADV on our markets in the short to medium term Fears over EU Calmer markets. IPO window Global sell-off over fears of Volatility spikes on ECB QE Greek debt Greek crisis China, deflation fully open slowing US economic growth, Greek uncertainty stand-off resolution commodities Ukraine – Russia conflict , / EM crisis ADV commodities, Greece. 35 STOXX 50 Volatility 18 000 VIX 2014 Volatility Peaks ADV levels tend to 16 000 30 2015 Volatility Peaks be 21% higher when volatility levels peak 2014 ADV above 20 14 000 2015 ADV YTD ) 25 STOXX 50 Historic Volatility Peak Barrier s VIX Historic Volatility Peak Barrier m r 12 000 ) e n t o l i a l n l i i m 20 m o € 10 000 N ( ( V y D t i l A i t a l o 8 000 V 15 +29.6% ADV YTD 6 000 10 4 000 5 2 000 - - 2014 2015 YTD Source: Euronext, TAG Audit, Bloomberg as of October 2015 6 Note: Domestic equities (electronic order book and regulated reported deals. Scope of MTFs – Smartpool, Chi-X, BATS, Turquoise, Equiduct, TOM MTF, NYSE Arca Europe
 Q3’2015 Results Page 6 Page 8